

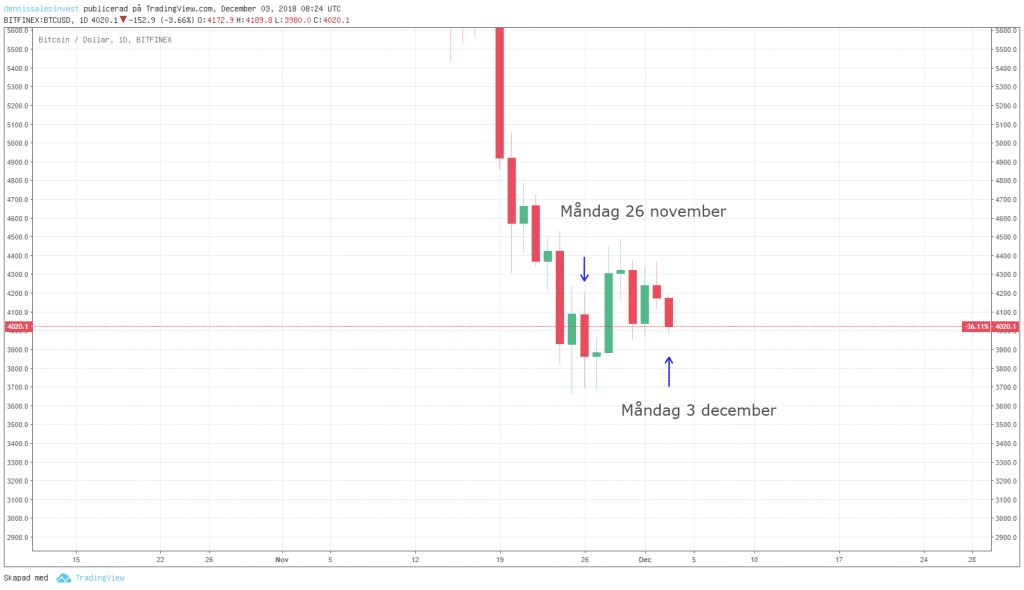
Last week, the bitcoin price began at $4,086. The price has been consolidated during the week, where we saw $3,657 at the lowest price and $4,488 at the highest price.
At the time of writing, the price is at $4,024. We are in a “traders market” where the price fluctuates up and down without any further direction, something that those who act in the shorter term can benefit from.
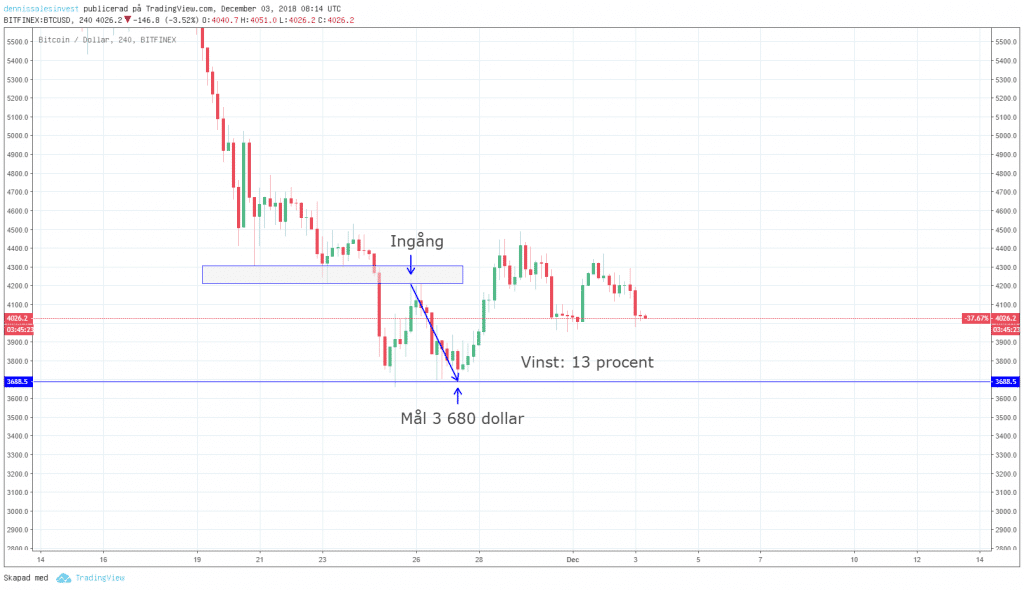
In my text last week, I shared a “short” opportunity. The price had fallen to around $3,680 and bounced back up to $4,200. The price reached a resistance zone and I placed a sell order (shorted), which means that I make money if the price falls.
Of course, I also placed a “stop loss” because I never know in which direction the price finally goes. However, the price went my way and I could get out of the position with a good profit.
Where will bitcoin go now?
Bitcoin is currently in an interesting situation. Historically, December has been a strong month for bitcoin, but the outcome may be different in 2018. Should you an investor stay out of the market or continue to invest? As usual, it depends on your strategy. But there are tools to keep an eye on when the trend turns.
“Bitcoin is currently in an interesting situation”
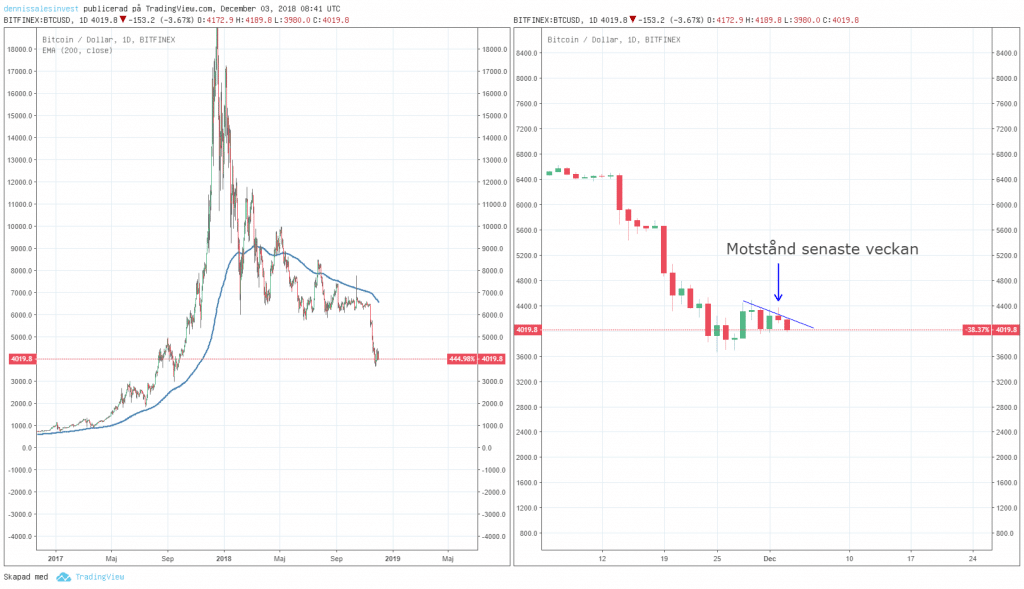
The image to the left below shows the price for bitcoin in 2018 and the thick marked line is an exponentially moving average (EMA) set for 200 days. Many see EMA 200 as the primary trend, and when the price breaks the EMA 200, a change in the trend has occured.
In order to translate it into today’s bitcoin curve, it means that we are in a downward trend until the price breaks over EMA 200. For those who are uncertain when to invest, it may be good to wait for EMA 200 to break and an upward market begins.
The right picture below shows the price of bitcoin during the past week. The buyers have tried to push up the price, but the peaks are getting lower and the sellers have the upper hand. I therefore think we will see even lower prices.
The question is of course: how low?
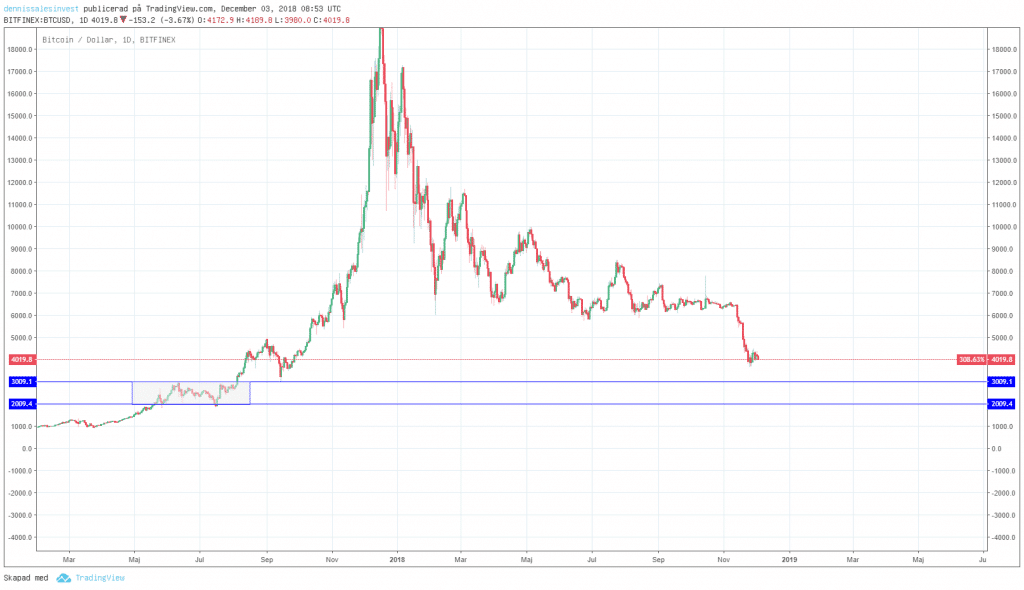
The next support that I see is at around $3,000 and then $2,000. Should the price break through $3,500, it can go down to $3,000 fast.
In the graph, however, we see the price of bitcoin for almost two years. Even though it does not feel so good watching the price fall, we must not forget that it is still on plus if we look at it over a two-year period, and that bitcoin is the best performing asset if we look at it in a longer time perspective.