


Bitcoin pushed through the resistance around $5,350 and is currently trading around $5,570. The question many ask themselves is, of course, what this means.
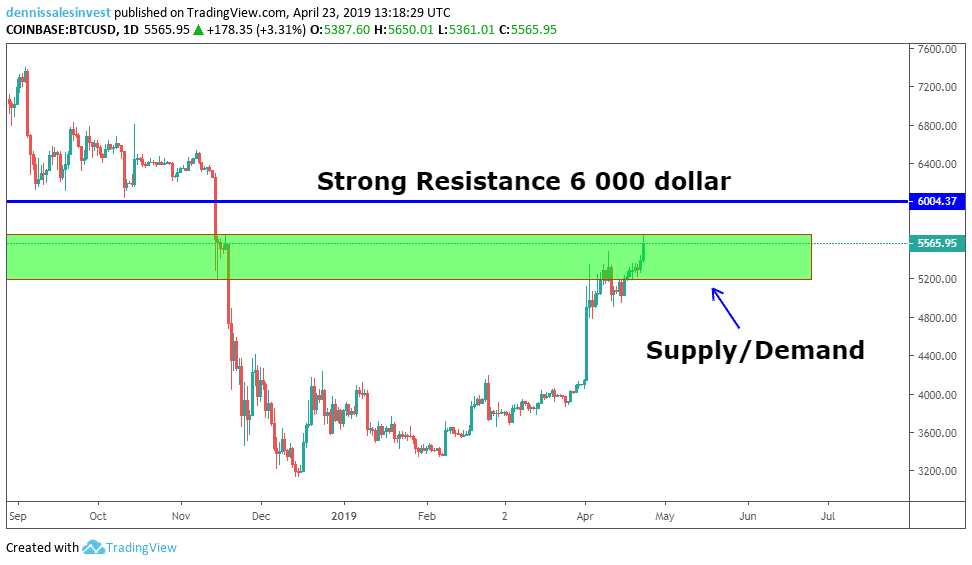
I think the price will rise to around $6,000 where a strong resistance rests and that we will see a decline from that area.
The sellers came back
Another option is that we see a decline from the top of the “supply/demand” area (the green area in the picture below), and it looks like the sellers actually came back just at the top of the zone.
In future updates, I will be analyzing from a longterm perspective.