

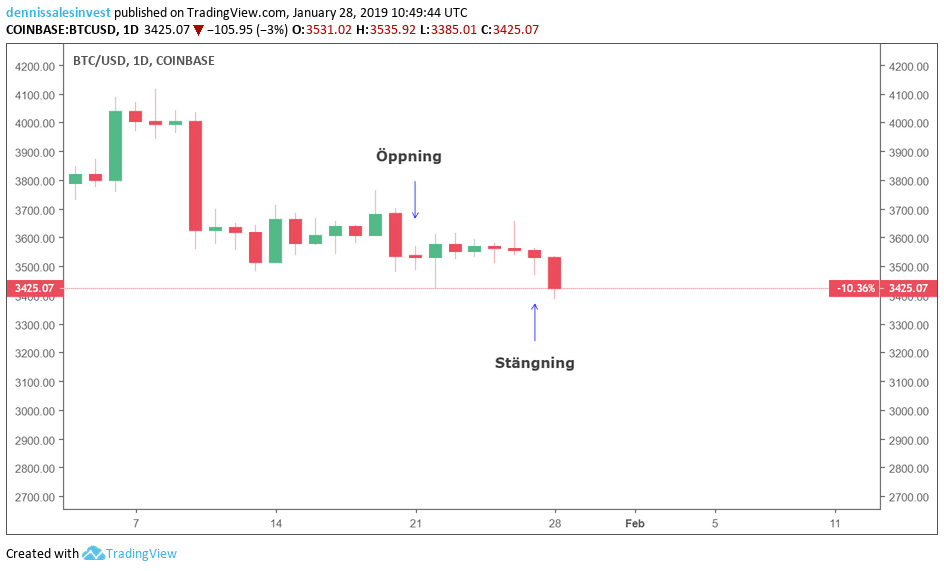
The bitcoin price started last week at around $3,568 and ended it at $3,470. The cryptocurrency is currently traded at $3,418.
The sellers continue to be in control and are pushing down the price lower. But how can we find out where the next outbreak will occur?
Here’s how to make a plan
When you look at a chart, such as the ones at Tradingview.com, you get to know how sellers and buyers interact with each other. It is possible to see what has happened historically and which price levels that sellers have thought to have been expensive and which levels buyers have thought to be cheap. In this way, we can make a plan for what can happen in the future.
I always start my analysis by zooming out considerably to get an overall picture. If we look at the graph for bitcoin and US dollars out of a weekly view, we get a helicopter view of the currency pair. The weekly view means that every candle you see in the picture corresponds to one week.
What can be seen is that the sellers pushed the price down considerably from $6,000 to $3,128. When the price fell to its present bottom, the buyers felt that it was cheap again and pushed up the price to $4,414 before the sellers took back the control. For a few months now, the price has been between these points.
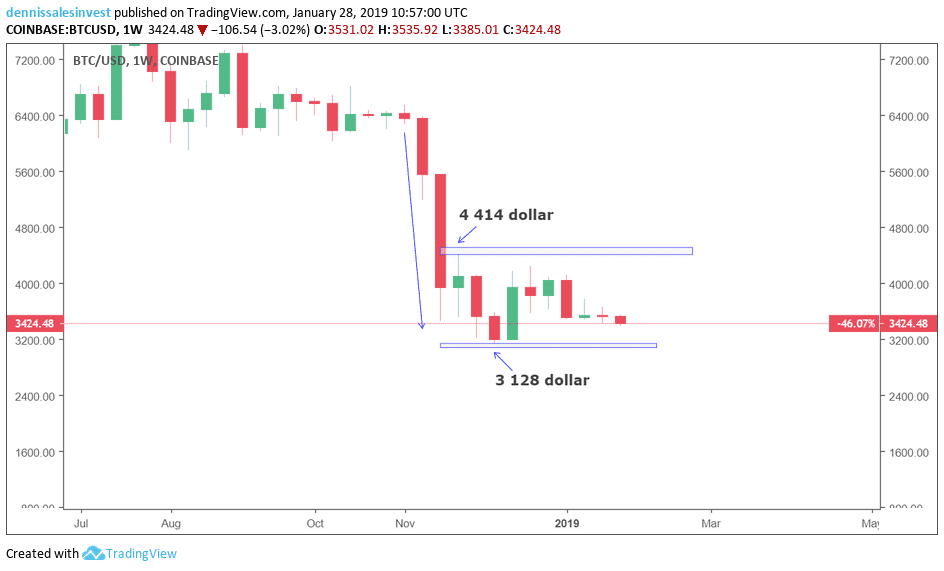
We have thus got two levels that are of the utmost importance and we are waiting for the price to break through one of these – either upwards or downwards.
However, it is important that the price not only breaks through but also closes the week above or below any of the levels for the outbreak to be confirmed. If you are waiting to see where the price will go, this is a good way to do it.
“Never chase the price, but wait for the price to come to you”
Remember that there is no rush to buy into an asset class, such as cryptocurrencies or shares. There will always be new opportunities. Never chase the price, but wait for the price to come to you.
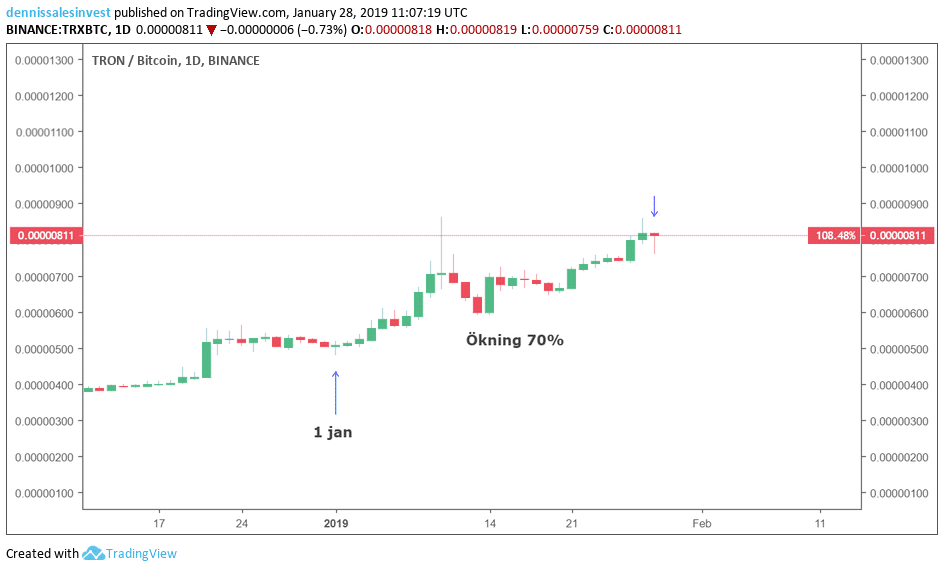
Tron has increased 70 percent against bitcoin
While we are waiting for an outbreak from bitcoin’s consolidation, there are other possibilities. Since January 1st, tron has increased 70 percent against bitcoin. This is due to a lot of positive news that have circulated around the cryptocurrency.
Bittorrent launches its own token (BTT) on the tron blockchain and everyone who owns tron will receive a share of Bittorrent tokens for free.
Thus, there are many opportunities even though bitcoin moves horizontally.